Microsoft Excel is a powerful tool that has become an essential part of many businesses and industries.
From basic data entry and calculations to complex financial analysis and data visualization, Excel offers a wide range of features and functionalities to help users manage and analyze their data effectively. In this article, we will explore some tips and tricks to help you master Microsoft Excel, whether you are a beginner or an advanced user.
1. Get familiar with the interface
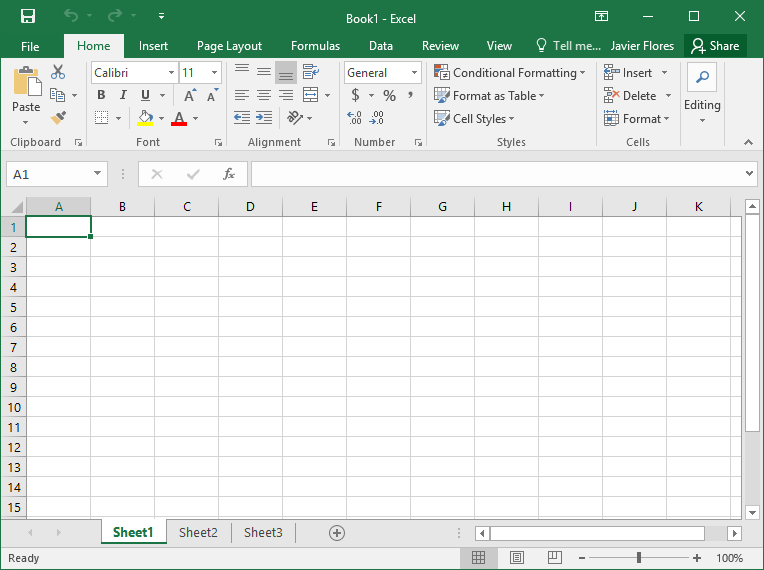
The first step to mastering Excel is to get familiar with its interface. Learn about the different tabs, ribbons, and menus, and how to navigate them efficiently. Take the time to customize the interface to suit your preferences, including adding frequently used commands to the Quick Access Toolbar.
2. Learn basic formulas and functions
Excel offers a vast range of formulas and functions to perform calculations and analyze data. Start by learning basic formulas like SUM, AVERAGE, and COUNT, and how to use them in simple calculations. As you become more proficient, explore more advanced formulas and functions to handle complex calculations.
3. Use keyboard shortcuts
Excel offers a wide range of keyboard shortcuts that can save you time and improve your efficiency. Learn some basic shortcuts like CTRL+C for copying, CTRL+V for pasting, and CTRL+Z for undoing. As you become more comfortable, explore more advanced shortcuts for formatting, navigation, and more.
4. Work with data efficiently
Excel offers many features to help you work with data efficiently. Learn how to sort and filter data, use conditional formatting to highlight data based on certain criteria, and use data validation to restrict data entry to specific values. These features can help you manage large datasets and make data analysis more manageable.
5. Use charts and graphs
Excel offers powerful tools for creating charts and graphs to visualize data effectively. Learn how to create different types of charts and graphs, including bar charts, line charts, and pie charts. Explore advanced features like trendlines and data labels to enhance your visualizations further.


